What is Quantifying Risk: Part II- Using Implied Volatility (IV) – September 8, 2025
In a recent article titled What is Quantifying Risk: Part I- Using Delta, one methodology of measuring the risk of our covered call writing and cash-secured put trades was analyzed. In this article, implied volatility (IV) will be investigated as another metric for estimating the risk in our trades.
What is implied volatility?
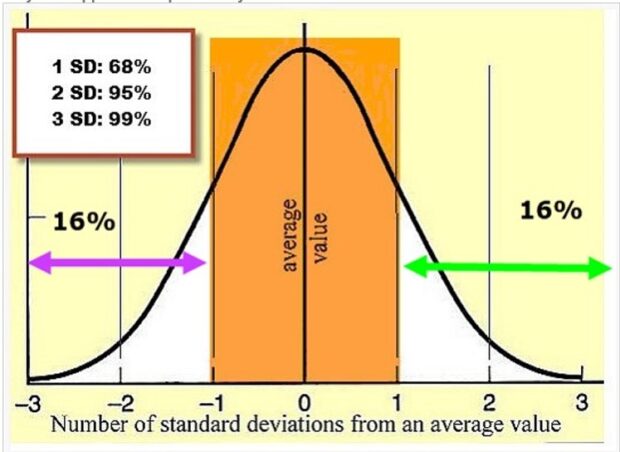
This is a forecast of the underlying stock’s (or ETF’s) price movement, up or down, as implied by the option’s price in the marketplace. IV stats are published on an annual basis (expected price movement over the next 1 year) and is based on 1 standard deviation (expected to fall into that range 68% of the time).
To make IV stats meaningful for a particular option contract, a conversion formula must be used. BCI’s Expected Price Movement Calculator has that formula inherent in the spreadsheet. By entering the at-the-money (ATM) IV, we can establish an approximate expected trading for any option contract. Strike prices can be selected based on this range depending on the strategy used.
Since the results are anticipated to fall outside this range 32% of the time (based on the 68% standard deviation), we can forecast a risk factor of 16% on either end of that range. Therefore, when using IV, we will assess our risk at approximately 16%.
Covered call risk example
We may not want our shares sold. We would then select an out-of-the-money strike based on the amount of risk we are willing to incur. This will vary from investor-to-investor. We also want to be sure that the premium returns align with our pre-stated initial time-value return goal range. Since mitigating risk comes at a cost, we would anticipate lower returns than traditional option selling.
Cash-secured put risk example
We may not want to purchase the underlying shares. We would then select an out-of-the-money strike based on the amount of risk we are willing to incur. This will also vary from investor-to-investor. We also want to be sure that the premium returns align with our pre-stated initial time-value return goal range. Since mitigating risk comes at a cost, we would anticipate lower returns than traditional option selling.
Real-life example with Alphabet, Inc. (Nasdaq: GOOG): Call Option-Chain on 5/1/2025
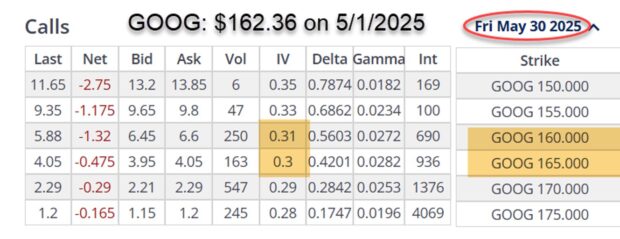
- With GOOG trading at $162.36, we look for the IVs of ATM (near-the-money, in this case) strikes
- The $160.00 and $165.00 strikes have IVs of 31% and 30%
- We’ll user 31% in the Expected Price Movement Calculator
BCI Expected Price Movement Calculator: GOOG calculations
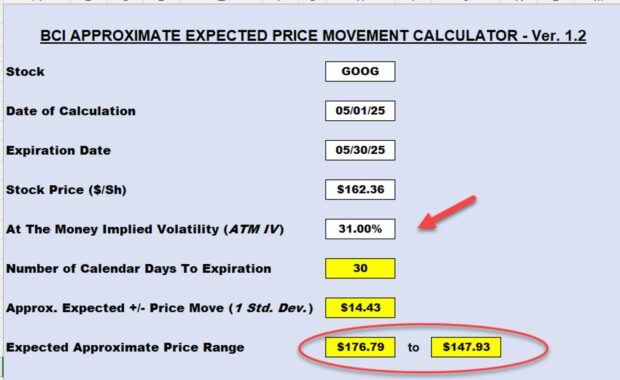
- After entering the ATM IV (31%), the spreadsheet projects a trading range of $147.93 to $176.79 during the 30-days of this contract
- Each end of this range represents a risk factor of 16% (16% on either side of 1 standard deviation)
- If we were selling an OTM cash-secured put that we didn’t want exercised, we’d select a strike near $147.93
- If we were selling an OTM covered call that we didn’t want exercised, we’d select a strike near $176.79
- These represent risk of exercise factors of approximately 16%. If less risk is preferred, we would use deeper OTM strikes
- The next step is to run the calculations using our Trade Management Calculator (TMC) to make sure the initial time value return goal range is satisfied
Discussion
The approximate amount of risk we are subject to in our option-selling trades can be quantified using implied volatility. The greater the risk that aligns with our personal risk tolerance, the higher will be our initial time-value returns and vice-versa. Despite taking defensive postures to our trades, the returns can still be significant.
Author: Alan Ellman