Calculating Multiple Call & Put Trades with the Same Stock in 2 Expiration Cycles – October 13, 2025
Calculating our covered call writing and cash-secured put trades can range anywhere from really simple to way too complicated. In this article, an example of the latter will be analyzed. Thanks to our BCI Trade Management Calculator (TMC), these “way too complicated” calculations can be converted to “quite manageable”.
Real-life example with Agnico Eagle Mines Ltd. (NYSE: AEM)
These trades were shared with me by a BCI Premium Member:
Cash-secured put trade (credits in green, debits in red)
- 4/28/2025: AEM trading at $118.29
- 4/28/2025: STO 5/16/2025 $115.00 put at @ $2.35
- 5/15/2025: AEM trading at $105.00 (3% guideline has us closing the trade at $111.55)
- 5/15/2025: Early assignment, shares purchased (put to Gerald) at $115.00 (unrealized loss 10.00/share)
AEM dramatically declined in price from $118.29 to $105.00 and early exercise resulted in shares being put to the investor at $115.00. Note the 3% guidelines was ignored which would have resulted in the trade being closed when share price reached approximately $111.55.
Covered call writing trades (credits in green, debits in red)
- 5/20/2025: STO 6/20/2025 $115.00 call at $2.77 (AEM at $105.00)
- 6/4/2025: AEM trading at $123.61
- 6/5/2025: Buy 6/20/2025 $120.00 put at $2.15 (protective put)
- 6/6/2025: AEM trading at $118.00 (the roller-coaster continues!)
- 6/6/205: BTC 6/20/025 $115.00 call at $5.00
- 6/6/2025: Sell 6/20/2025 $120.00 put at $4.30
- 6/6/2025: Sell AEM at $117.67 (net gain of $2.67/share)
The protective put was bought and sold at a profit. ($2.15). The option sale and buyback ($2.77 and $5.00) resulted in a net debit of $0.08. In our covered call spreadsheet, we will enter a premium of $4.92, which represents the $2.77 call premium and the $2.15 net credit. This allows us to use just 1 spreadsheet for the series of call trades.
Calculations for the put trade
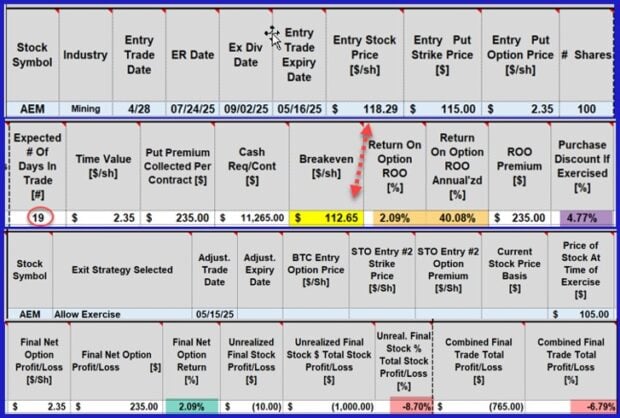
- The breakeven price point is lowered from $118.29 to $112.65 (yellow cell)
- The initial return is a 19-day 2.09%, 40.08% annualized (brown cells)
- If shares are “put” to us at that breakeven price, it will represent a discount of 4.77% (purple cell) from the price at trade entry
- After exercise of the put option, the final realized return on the option side is +2.09% (green cell), but with an unrealized loss on the stock side (-8.70%), the net return was an unrealized loss of 6.79%.
Calculations for the call trades
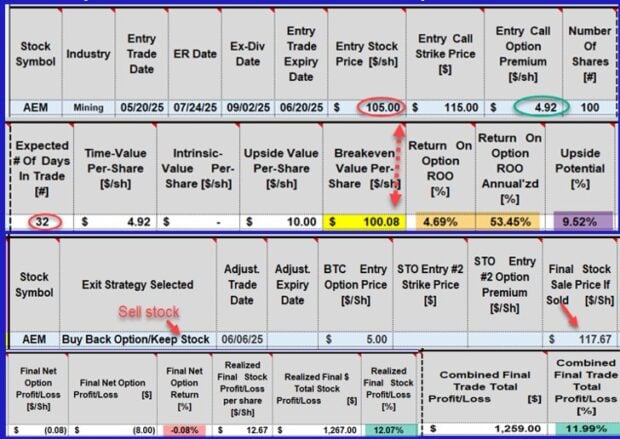
- The $4.92 call premium (green oval) = put gain ($2.15 + call premium $2.77)
- The breakeven price point is lowered from $105.00 to $100.08 (yellow cell)
- The initial return is a 32-day 4.69%, 53.45% annualized (brown cells)
- There is an opportunity for an additional upside potential of 9.52% (purple cell) if share price moves from $105.00 to the OTM $115.00 call strike
- After closing the call option, and selling the shares, there is a realized option loss of 0.08% (pink cell) and a stock realized gain of 12.07%, netting a final gain of 11.99% (green cell)
Combined Realized 39-Day Results
- Put trade (includes share loss of $10.00/share) = -6.79% (unrealized)
- Call trade (includes put realized credit) = +11.99% (realized)
- Realized 39-day return = 5.20%, 49.51% annualized
Discussion
- This series o AEM trades resulted in a significant overall return
- Abiding by our 3% guideline, there was the potential for much higher returns
- The BCI Trade Management Calculator will facilitate calculations for both simple and complicated scenarios
- Re-evaluating trades like these is one of the best ways to enhance our trading skills and achieve the highest possible returns
Author: Alan Ellman