Managing Multiple Put Trades with Multiple Expirations Using the Trade Management Calculator – July 4, 2026
Calculating initial returns for our covered call writing & cash-secured put trades is intuitive and straightforward. For puts, we divide the premium by the difference between the put strike and the put premium:
% initial put return = [(put premium/ (put strike – put premium)]
When trade adjustment opportunities (exit strategies) are implemented, the accurate archiving and calculations of the trades can be somewhat challenging. Enter the BCI Trade Management Calculator (TMC). In this article, a real-life example with Howmet Aerospace Inc. (NYSE: HWM) will be analyzed demonstrating a series of put trades involving 2 exit strategies with 2 expiration dates. This trade was shared with me by a premium member.
Real-life example with HWM
- 1/22/2026: HWM trading at $221.00
- 1/22/2026: STO 1 x 1/30/2026 $210.00 put at $1.49 (9-day trade)
- 1/30/2026: HWM trading at $208.08, leaving the $210.00 strike now ITM
- 1/30/2026: BTC the 1/30/2026 $210.00 put strike at $2.00
- 1/30/2026: STO 1 x 2/6/2026 $207.50 put strike at $3.49 (roll-down)
- 2/6/2026: The $207.50 strike remains OTM and is closed at $0.04
Implementing the Trade Management Calculator (TMC) with Multiple Expiration Dates
The TMC can be utilized in a myriad of ways. Here’s how I do it:
When using multiple exit strategies with multiple expiration dates, we can use more than 1 TMC spreadsheet. The first spreadsheet is for the 1/30 expiration and the 2nd for the 2/6 expiration. Each contract expiration has 1 STO & 1 BTC. You will note that the 1st shows a net debit of $51.00; the 2nd, a net credit of $345.00, resulting in a net credit of $294.00. More on this later.
TMC Spreadsheet for the 1/30/2026 Expiration
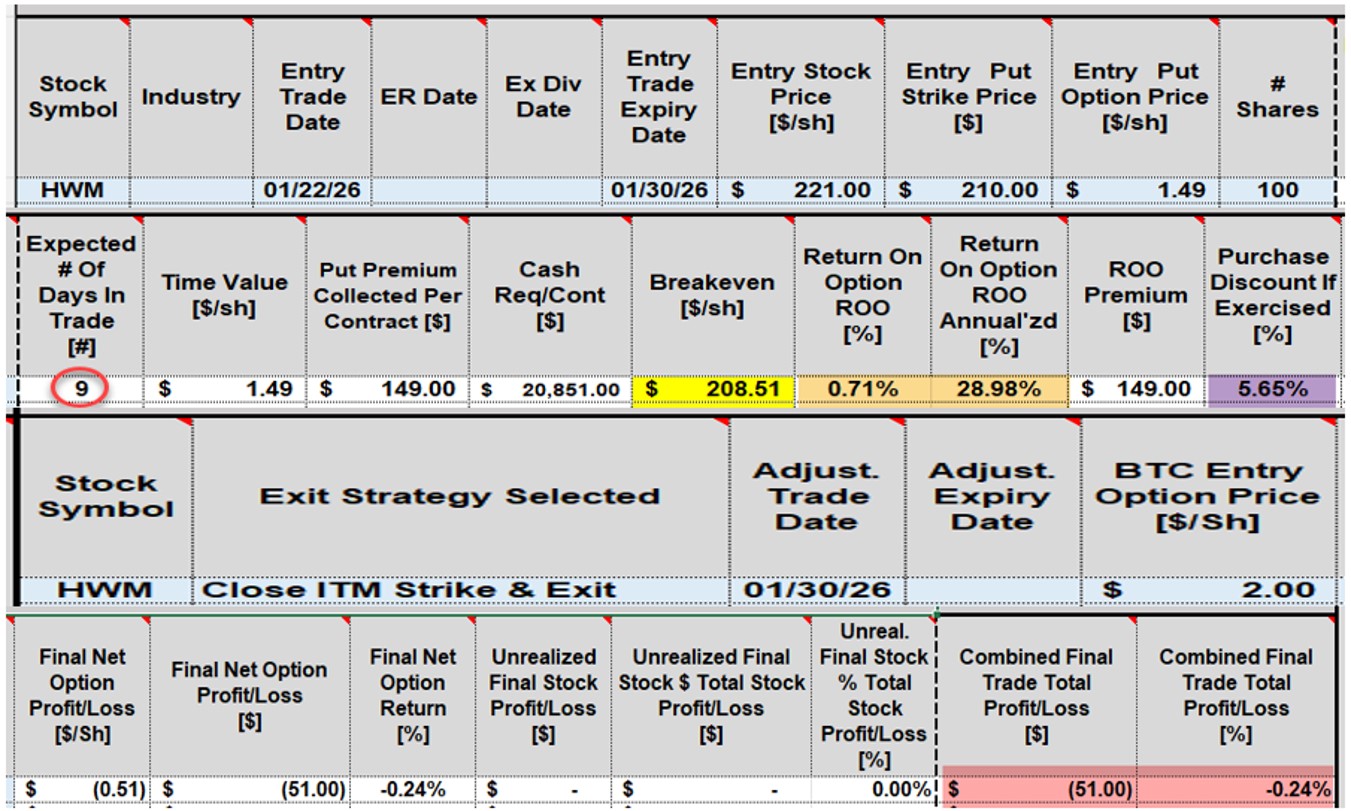
- Red circle: This is a 9-day trade if taken through contract expiration
- Yellow cell: The breakeven price point (BE) is $208.51
- Brown cells: The initial 9-day return is 0.71%, 28.98% annualized
- Purple cell: If HWM drops below the $210.00 strike and the put is not bought back (closed), shares will be purchased at a 5.65% discount (the BE price)
- Pink cells: After closing the option at $2.00, there is a net option loss of $51.00 or 0.24%
TMC Spreadsheet for the 2/6/2026 Expiration: HWM closes at $222.60
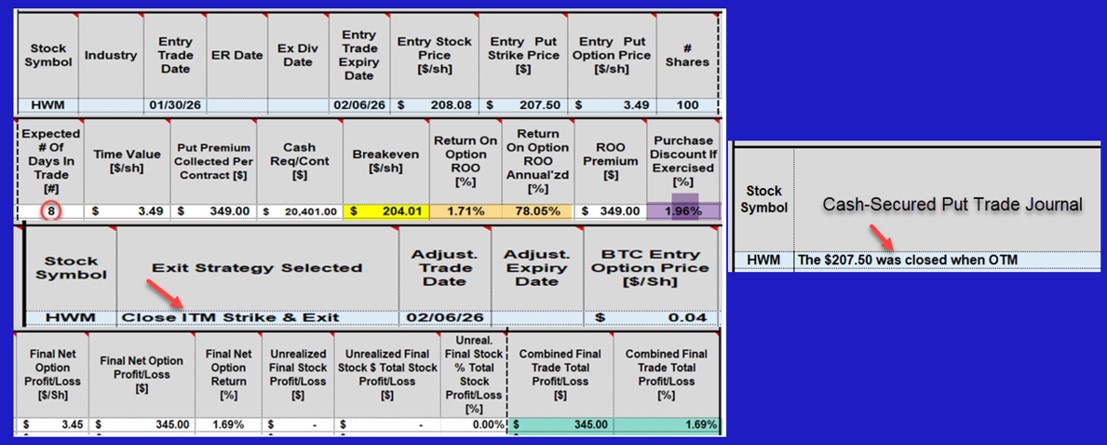
- Red circle: This is an 8-day trade if taken through contract expiration
- Yellow cell: The breakeven price point (BE) is $204.01
- Brown cells: The initial 8-day return is 1.71%, 78.05% annualized
- Purple cell: If HWM drops below the $207.50 strike and the put is not bought back (closed), shares will be purchased at a 1.96% discount (the BE price)
- Green cells: After closing the option at $0.04, there is a net option gain of $345.00 or 1.69%
- Note that the current TMC does not include an exit strategy to close an OTM strike, something we are considering, even if this is rarely used. As an alternative, we can make a notation in the Trade Journal, as shown on the right side of the screenshot
Final Combined 16-Day Returns
- Net credit = $345.00 – $51.00 = $294
- Cost basis: $210.00 – $1.49 = $208.51
- % 16-day return = 1.41%
- Annualized return = 32.17%
- Note: There was no need to close the deep OTM $207.50 contract on 2/6/2026. But costs only $0.04, so no harm